New data shows the impact of BID activity in the District
09 November 2022
Colmore Business District has made a name for itself as the place to do business in Birmingham. We’re home to a wide range of professional services. Lawyers, accountants, consultants; you name it, we’ve got it. We also have an exciting hospitality scene which was growing at an astounding rate back in 2019.
We all know what then took place in 2020. 18 months of lock downs, tier restrictions (remember those!) and COVID waves saw the city centre, and our District almost empty of people and vitality. The challenge for businesses and the BID was two fold; how should we navigate the pandemic as it happened and how do we support businesses as the world starts to unlock.
Colmore BID undertook a broad range of projects. Some of them were very practical in nature; parklets provided additional outdoor seating and Summer in the Square created a space to be enjoyed in line with the restrictions in place at the time. Other projects were more strategic, and we continue to work to deliver aspects of our pioneering research, the Future Business District study. What we needed to complement this work was a way to measure our impact.
With this in mind, and with the support of Birmingham City Council, Colmore BID positioned a series of footfall cameras at key points in the District to measure the flow of people. These cameras don’t record people’s images; they simply provide a “count” of the number of people moving through a small area to give an indication of how many people are moving around a specific location. The locations we chose were Colmore Row, the junction of Newhall Street, Cherry Street and Temple Street. Each of these locations are key gateways in and out of the District. The footfall cameras have been in place for just over a year, which means we can now use the data to compare how activity changes in the District.
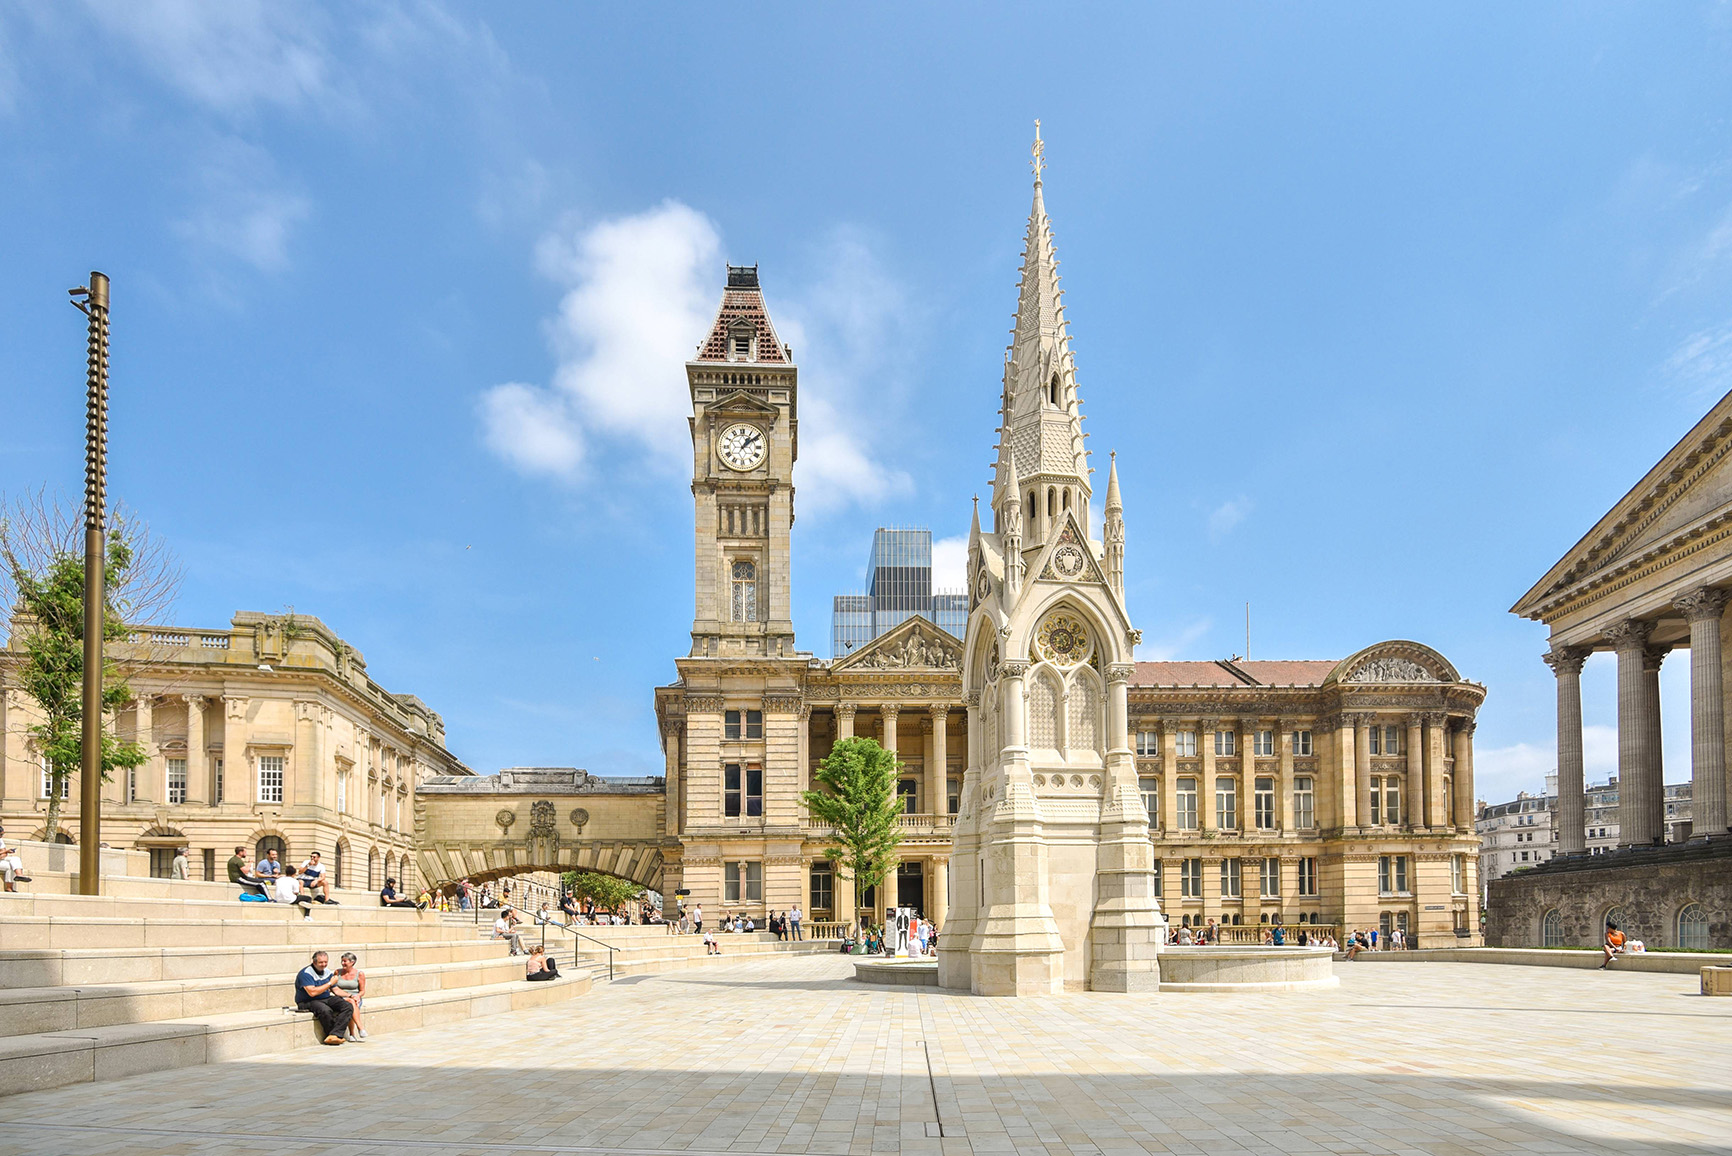
We have looked at the data for the last year, from October 2021 – October 2022. During this time 31,155,887 people have been counted moving through the District. The busiest location is Cherry Street; 64% of our footfall moves through this location. For those who are in the Cathedral Grounds during rush hour, this will come as no surprise!
One of our key projects to reinvigorate the District was Christmas in Cathedral Square. The project won a national award at the ATCM Town and City Management Industry Awards this year, but what was the measurable impact of this project? Whilst we aren’t able to directly compare the market period in 2020 to December 2021, looking at the data for the five weeks previous to the market, it’s clear it had a positive effect. In the five weeks preceding the market, 2,894,244 people were counted as moving through the District. During the market period, this rose to 3,636,144.
Based on the preceding five weeks, the average footfall across the District was 578,849 per week. This increased to 768,891 in the first week of the market. Based on this average comparison, and the totals, we are confident that Christmas in Cathedral Square achieved one of its key goals; to drive footfall into Colmore Business District.
The project wasn’t immune to the effects of COVID 19. The last week of the market started on Monday 13 December 2021, and saw footfall drop from 713,993 to 659,607. An update given by the then Prime Minister Boris Johnson only 24 hours beforehand warned of the incoming peak of Omicron infections and, no doubt, reminded many of us of the constrained Christmas celebrations of 2020. The impact of this is clearly shown by this drop in the footfall count.
Overall, however, the picture from one Autumn to another is one of significant improvement. This year saw the Commonwealth Games take over the city. The Games saw footfall shoot up with 857,729 more people moving through the District than compared with the same time last year. Saturday 6 August 2022 saw the District heaving with people, counting 131,466 people moving through the District, an increase of 85% on the same day in 2021. Even accounting for extraordinary events like this, footfall in the District continues to recover. In the last quarter alone, 8,530,592 people were counted moving through the District, an increase of 38% on the year beforehand.
Footfall data has provided the District with a new way of analysing the impact of both events outside of our control, and our own projects. We will continue to share insights with you on a regular basis.